
You want to invest in equity markets for the long term.
You are given a choice of 3 strategies.
- Invest every month by way of SIPs
- Invest only when the market hits 52-week highs.
- Invest only when the market hits 52-week lows.
Which approach do you think will give the best results?
Intuitively, investing on 52-week lows look like the winner. Because, well, you are investing at lower levels.
What does the data tells us?
I have used Nifty 50 TRI data for this analysis. I consider Nifty TRI data from June 1999 until October 31, 2020.
3 strategies. You can invest Rs 10,000 per month.
- SIP: You invest Rs 10,000 per month in Nifty 50 TRI on 1st of each month.
- 52-week Highs: You invest only when the 52-week highs on the index are hit. It is possible that you may not be able to invest every month. In that case, you keep accumulating the funds (cash) and invest on the day when the next 52-week high is reached. For instance, you start investing in July 2000 but the next 52-week high is hit on June 29, 2013. Hence, you must wait for almost 3 years to invest. In those 3 years, you would have accumulated cash of Rs 3.6 lacs (10000 X 36). You invest the entire amount on June 29, 2013.
- 52-week Lows: Same as 52-week high strategy. The only difference is that you invest on 52-week lows as against 52-week highs.
It is further assumed that cash earns no return.
The Results

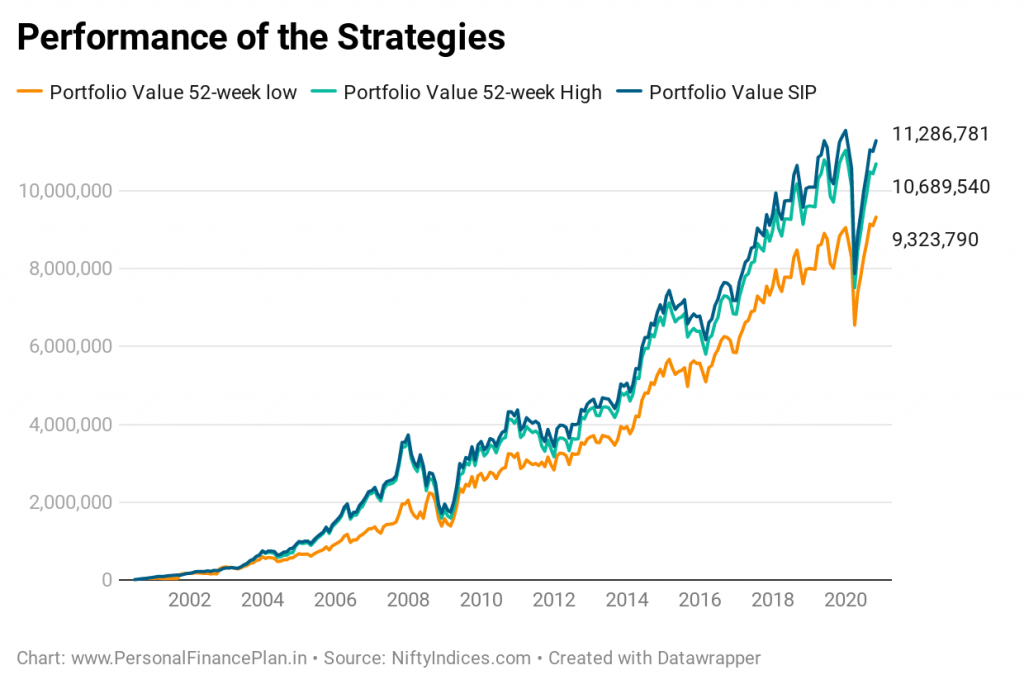
Investing at 52-week lows has performed the worst.
Plain vanilla SIP is the winner.
This looks counterintuitive. How did this happen?
You would expect that you would end up with a higher value in case of investing on 52-week lows. However, as you can see from the above chart, this is not the case.
Investing on 52-week lows is the worst performer.
However, such a result is not unexpected in up-trending markets.
Let me try to explain with the help of an extreme hypothetical example.
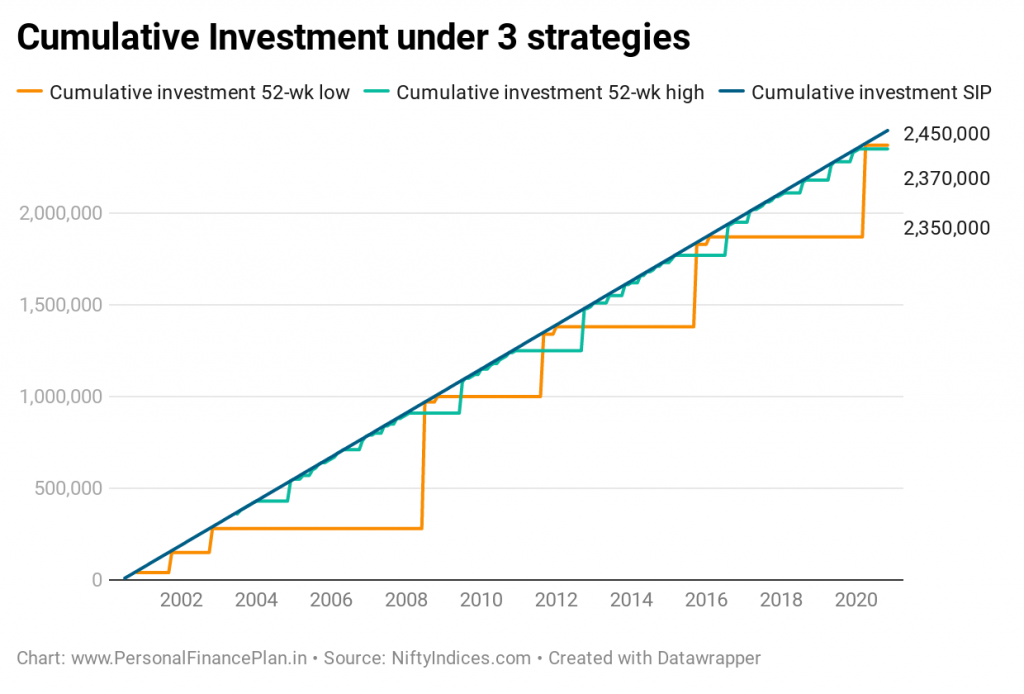
Let’s say the index is at 1,000. Over the next few years, it keeps hitting 52-week highs and reaches 10,000. If you were investing at 52-week high, you would have invested multiple times during this period. Let’s say at 1000, 2000, 3000, 4000, 5000 and so on.
On the other hand, if you were investing on 52-week lows, you wouldn’t have invested a single penny. Once the index hits 10,000, it does not move further and become rangebound. It is possible that over the next few months, it will form a 52-week low at 9,000. You will invest. And you just don’t invest for that month. You invest the entire amount that you have set aside for equity investment until now.
52-week high investor: Invested money across multiple levels (1000, 2000, 3000, and so on).
52-week low investor: Invested all the money at index level of 9000.
By the way, there is no guarantee that the index will bounce back after hitting 52-weeks. It can form even lower lows. However, our assumption in this exercise is that we invest all the pending funds as soon as 52-week low (or 52-week highs) is hit. Hence, the index may go much lower than 9000 but you won’t have money to invest at such levels.
Even bigger problems with 52-week High or 52-week Low approach
You may remain under-invested in equities if you keep waiting for 52-week lows to invest. For the period under consideration (July 2000-November 2020), Nifty formed 52-week low on only 55 days. On the other hand, it formed 52-week high on 791 days. Not unexpected since the Nifty 50 TRI moved from 1599 on July 1, 2020 to 16542 on October 31, 2020. You can expect more 52-week highs than 52-week lows if the index has gone over 10 times.
If you work with the premise that the equities do not well over the long term, you can expect this trend (more 52-week highs than 52-week lows) to continue in the future too.
The wait to invest can be atrocious. I don’t know about you, but I cannot keep waiting for an eternity to invest. At one point or the other, I will just fold up and start investing. Difficult to stick with such an approach. By the way, this is true for investing on 52-week highs too.

Moreover, you will need great courage to invest. Let’s say you were waiting for 52-week lows to invest. You didn’t invest anything for 3 years. So, you have accumulated Rs 3.6 lacs (10,000 X 36 months) to invest. You can expect that the market outlook and the market commentary will be quite scary when 52-week lows are formed. You need to summon up a lot of courage to invest the money (that you didn’t invest for 3 years) to invest at one go when the media is spelling doom and gloom for the markets. As I mentioned earlier, there is no guarantee that the index will bounce after hitting 52-week lows and you know that. Not easy.
I do not mean that SIPs are the best way to invest. We discussed in an earlier post that SIPs do not guarantee good returns. You may test out data based on other fundamental or technical measures to pace your investments in equity markets. With at least some of the measures, you will get better returns than a SIP. However, SIPs remain a super way to invest in equity markets for most investors. SIPs enforce discipline and eliminate the emotional or gut-based part of investments.
The Caveats
- I have assumed 0% percent return on cash. If you assume a return on cash, you can expect the performance of 52-week low or 52-week high strategies to improve.
- If you are investing by way of SIPs, then you won’t earn anything as return on cash. Why? Because you do not keep any cash. You invest 10,000 on 1st of each month.
- The positive return on cash will help if you work with a strategy where you may have to wait to invest. In this case, investing on 52-week lows or 52-week highs are such strategies.
What should you do?
In my opinion, waiting for 52-week highs or 52-week lows to invest are not good strategies to follow. And I do not even want to go into comparing the performance. I have considered a snapshot in time (one fixed starting point and one fixed ending point). The results may vary for different periods. My biggest problem is these approaches is that it is insanely difficult to just sit on money (possibly for years) and not do anything.
For instance, if you were investing on 52-week lows, you would have to wait from November 2002 until June 2008 to invest. That’s a period of 67 months. Over 5 years. No 52-week lows during the period. Nifty 50 TRI went from 1021 to 4008. So, between these 52-week lows, you have missed 4X rally (Consider this. Everybody around you is making loads of money). By the way, Nifty TRI hit a high of 4938 during this period. I don’t know about you, but I just don’t have so much patience. I am more comfortable managing risk through asset allocation. Even 52-week highs can be far apart. We started this analysis from July 1, 2000. The first 52-week high was formed in June 2003.
SIPs are simpler and easier to execute.
Trust your judgement.
Disclaimer: Registration granted by SEBI, membership of BASL, and certification from NISM in no way guarantee performance of the intermediary or provide any assurance of returns to investors. Investment in securities market is subject to market risks. Read all the related documents carefully before investing.
Note: This post is for education purpose alone and is NOT investment advice. This is not a recommendation to invest or NOT invest in any product. The securities, instruments, or indices quoted are for illustration only and are not recommendatory. My views may be biased, and I may choose not to focus on aspects that you consider important. Your financial goals may be different. You may have a different risk profile. You may be in a different life stage than I am in. Hence, you must NOT base your investment decisions based on my writings. There is no one-size-fits-all solution in investments. What may be a good investment for certain investors may NOT be good for others. And vice versa. Therefore, read and understand the product terms and conditions and consider your risk profile, requirements, and suitability before investing in any investment product or following an investment approach.
Additional Links
Over the past few months, we have tested various investment strategies or ideas and compared the performance against the Buy-and-Hold Nifty 50 portfolio. In some of the previous posts, we have:
- Assessed whether adding an International Equity Fund and Gold to an Equity portfolio has improved returns and reduced volatility.
- Does Momentum Investing work in India?
- Does Low Volatility investing beat Nifty and Sensex?
- Nifty 200 Momentum 30 Index: Performance Review
- Nifty Factor Indices (Value, Momentum, Quality, Low Volatility, Alpha): Performance Comparison
- Nifty Alpha Low Volatility 30: Performance Review
- Considered the data for the past 20 years to see if the Price-Earnings (PE) multiple tells us anything about the prospective returns. It does, or at least has in the past.
- Tested a momentum strategy to shift between Nifty 50 and a liquid fund and compared the performance against a simple 50:50 annual rebalanced portfolio of Nifty index fund and liquid fund.
- Used a Simple Moving Average Based Market Entry and Exit Strategy and compared the performance against Buy-and-Hold Nifty 50 over the last two decades.
- Compared the performance of Nifty Next 50 against Nifty 50 over the last two decades.
- Compared the performance of Nifty 50 Equal Weight vs Nifty 50 vs Nifty 50 over the last 20 years.
- Nothing works all the time. Used Nifty 50, Nifty MidCap 150, and Nifty Small Cap 250 index to demonstrate that sometimes intuitive investment choices do not work.
- Compared the performance of 2 popular balanced funds against a simple combination of an index fund and a liquid fund.
- Compared the performance of a popular dynamic asset allocation fund (Balanced advantage fund) against an equity index fund and see if it has been able to provide reasonable returns at low volatility.