Smaller is better. At least that’s what many investors believe when it comes to equity investing in India.
And the data does seem to support this view. Over the last two decades, mid and small cap indices have delivered significantly higher returns than Nifty 50. Well, at least on the surface.
But is it really that simple? Does going smaller always mean higher returns? And more importantly, can you handle the ride?
What Does This Post Cover?
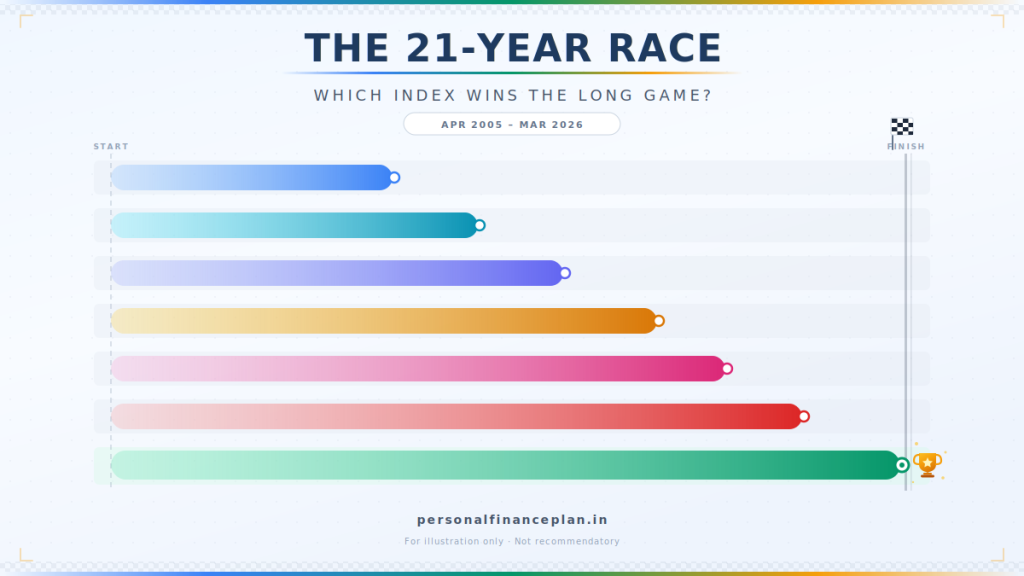
In this post, let us compare the performance of 8 cap-based indices over the last 21 years (April 1, 2005, to March 31, 2026). I have considered the Price index (and not the Total Returns index) for the analysis. Have considered 250-day year for analysis in this post. We will look at calendar year returns, CAGR, rolling returns, and risk metrics to understand how these indices have actually behaved.
The 8 cap-based indices considered for this analysis:
- Nifty 50
- Nifty 100
- Nifty 500
- Nifty Large & Midcap 250
- Nifty Next 50
- Nifty Midcap 150
- Nifty Smallcap 250
- Nifty Microcap 250
Disclaimer: I have used Claude AI extensively for this performance analysis. While I have done a few sample checks and the findings look fine directionally, it may still contain inaccuracies. Please do further research or consult your investment adviser before acting on the information shared in this post.
The Basics: How Are These Indices Different?
Before we get to the numbers, a quick refresher.
Nifty 50 tracks the 50 largest companies by market capitalization. Nifty 100 extends this to the top 100. Nifty 500 is a broad market index covering the top 500 companies. Nifty Large & Midcap 250 combines the top 100 large caps and the next 150 midcaps. Nifty Next 50 tracks companies ranked 51-100 by market cap. Nifty Midcap 150 covers companies ranked 101-250. Nifty Smallcap 250 covers companies ranked 251-500. And Nifty Microcap 250 goes even further down the market cap spectrum.
Note that as you move down the market cap ladder, you are essentially investing in smaller and less liquid companies. As an investor, the expectation is that you get compensated for this additional risk through higher returns. But does the data support this? Let’s find out.
Calendar Year Returns

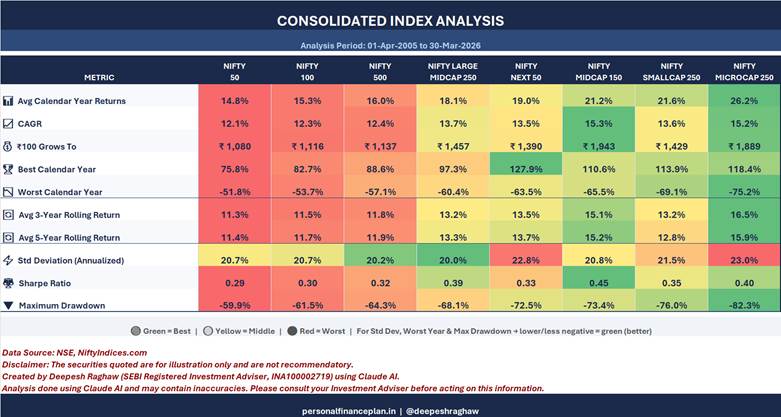
Look at the average calendar year returns across these 21 years. Nifty 50 delivered 14.8%. Nifty Midcap 150 delivered 21.2%. And Nifty Microcap 250 delivered 26.2%. The pattern is clear. Smaller the stocks, higher the average returns.
But now look at the individual years. In 2008, Nifty 50 fell 51.8%. Nifty Smallcap 250 fell 69.1%. Nifty Microcap 250 fell 75.2%. In 2018, Nifty 50 was up 3.2% while Nifty Microcap 250 was down 27.7%. And in 2011, Nifty 50 fell 24.6% while Nifty Microcap 250 fell 41.6%.
The ride gets significantly rougher as you go smaller, right?
In the good years, the smaller indices deliver excellent returns. In 2009, Nifty Next 50 delivered 127.9%. Nifty Microcap 250 delivered 118.4%. In 2014, Nifty Microcap 250 was up 103.3%. And in 2007, Nifty Smallcap 250 was up 94.9%.
Good years are fine, but during the investment journey, bad years matter too.
Consolidated Performance: Where the Real Story Lies
Average Returns vs CAGR: Mind the Gap
The average calendar year return for Nifty Microcap 250 is 26.2%. But the CAGR is only 15.2%. That’s a massive gap of about 11 percentage points.
For Nifty 50, the average return is 14.8% and the CAGR is 12.1%. The gap is only about 2.7 percentage points.
Why does this happen? Because of volatility drag. The more volatile the returns, the larger the gap between average returns and CAGR. Hence, while the average returns for smaller indices look spectacular, the actual wealth creation (captured by CAGR) is not as dramatic as it appears.
Rs 100 Grows To…
If you had invested Rs 100 in April 2005, here’s what it would have become by March 2026:
- Nifty 50: Rs 1,080
- Nifty Midcap 150: Rs 1,943
- Nifty Smallcap 250: Rs 1,429
- Nifty Microcap 250: Rs 1,889
Nifty Midcap 150 actually created more wealth than Nifty Microcap 250. Sounds a bit strange. Doesn’t it? Despite Microcap 250 having higher average returns. This is the volatility drag at work.
Risk: The Uncomfortable Truth
Nifty 50 has a standard deviation of 20.7% and a maximum drawdown of -59.9%.
Nifty Microcap 250 has a standard deviation of 23% and a maximum drawdown of -82.3%. An 82% fall means your Rs 1 lac becomes Rs 17,700. And then you need a 449% rise just to get back to where you started.
Now to the Sharpe ratio (risk adjusted returns). Higher the better.
Nifty Midcap 150 has the highest Sharpe ratio at 0.45. Nifty 50 has the lowest at 0.29.
Nifty Small Cap 250 at 0.35. Nifty Microcap 250 sits at 0.40, lower than Midcap 150.
Rolling Returns: Consistency Matters
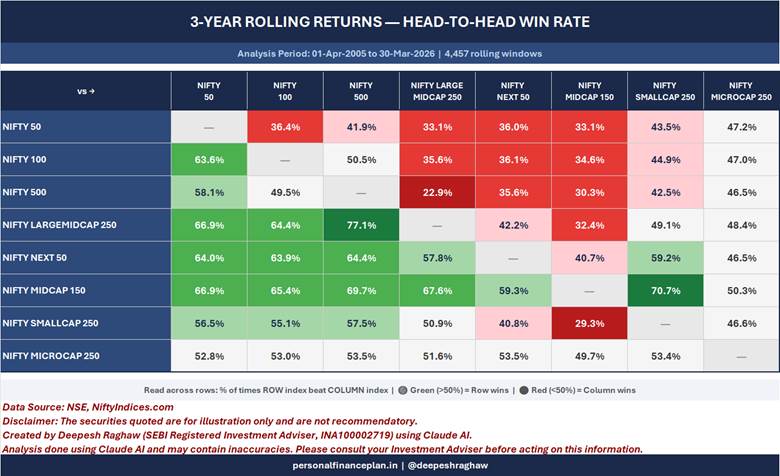

Rolling returns give you a sense of consistency.
To me, the surprise part is that Nifty Small Cap 250 losing out to Nifty Midcap 150 over 80% of the time in 5-year rolling returns. 70% in 3-year rolling returns.
You would have expected Nifty Small Cap 250 to beat Nifty Midcap 150 over the long-term. After all, it has even smaller stocks. It does seem to outperform point-to-point over 21 years, if you look at just the average calendar year returns. However, when you look at the CAGR, rolling returns etc., the small cap index falls behind quite a bit.
And that’s not it. On 5-year rolling returns, Nifty Smallcap 250 beat Nifty 50 only about 48.9% of the time. Less than half. So, despite the higher average returns, if you had invested in Nifty Smallcap 250 for any random 5-year period, there was a good chance Nifty 50 would have done better.
How do you use this information?
- Do not trust the data blindly. There may be errors in my analysis.
- The intent of this post is NOT to demonstrate superiority of one index over another. And you should also NOT review this analysis in this context. You don’t have to be the best to be happy.
- Do not just focus on the returns. I have shown long-term data. Hence, for some of the indices, the long-term data may look very impressive. Firstly, past performance does not guarantee future performance. Secondly, the long-term data usually looks quite smooth. It will conveniently hide the volatile journey that a particular index would have taken you through. Or rather you tend to ignore those aspects and focus merely on the returns. Long-term, for most investors, is just a series of short-term investments. Hence, before considering any of the indices chosen for this post, you must look beyond the returns data as well.
- Conviction in an investment strategy is critical. No investment strategy, no matter how good, works all the time. No investment strategy, no matter how bad, fails all the time. The ups and downs will test your patience. If you lack conviction, you will mostly likely jump the ship at the wrong time.
- Focus on building a low-cost diversified long-term portfolio.
The Caveats
- Past performance (or outperformance) does not guarantee future performance (outperformance).
- While I have considered the data from April 1 2005, many of these indices were launched much later. Hence, the outperformance by these factor indices may simply be a result of back-fitting. I wrote a post in early 2025 where I compared the performance of factor indices since launch.
- I have shown returns for indices. You don’t invest in indices. You invest in index funds or ETFs. Such products will have tracking difference for various reasons and will lower your returns. The tracking difference may increase if the underlying stocks are less liquid.
Source
Disclaimer: Registration granted by SEBI, membership of BASL, and certification from NISM in no way guarantee performance of the intermediary or provide any assurance of returns to investors. Investment in securities market is subject to market risks. Read all the related documents carefully before investing.
This post is for education purpose alone and is NOT investment advice. This is not a recommendation to invest or NOT invest in any product. The securities, instruments, or indices quoted are for illustration only and are not recommendatory. My views may be biased, and I may choose not to focus on aspects that you consider important. Your financial goals may be different. You may have a different risk profile. You may be in a different life stage than I am in. Hence, you must NOT base your investment decisions based on my writings. There is no one-size-fits-all solution in investments. What may be a good investment for certain investors may NOT be good for others. And vice versa. Therefore, read and understand the product terms and conditions and consider your risk profile, requirements, and suitability before investing in any investment product or following an investment approach.